
Three weeks into harvest, you're running temperature checks on 47 active fermentations. Your assistant winemaker pulls a sample from tank B-14, marks the Brix at 12.8, moves on. What nobody catches: that same tank was at 13.2 yesterday morning and 13.9 the afternoon before. The fermentation isn't just slowing — it's stalling in a pattern that screams H2S production incoming.
Four days later, someone notices the rotten egg smell. You're looking at copper additions, extended aging, maybe losing your entire reserve program for that block. All because your fermentation monitoring protocols focus on absolute values instead of trend velocities.
The sampling cadence problem nobody talks about
Most wineries sample based on calendar intervals. Every 24 hours during active fermentation. Every 48 hours near completion. Weekly during MLF. This approach misses fermentation dynamics — the rate of change tells you more than any single measurement.
A proper fermentation monitoring system tracks velocity patterns, not just current values. When Brix drops from 24 to 22 in day one, then 22 to 21 in day two, that deceleration pattern predicts problems 48-72 hours before they become sensory detectable.
Prioritize twice-daily sampling during early and late fermentation stages to capture meaningful velocity changes.
The operational challenge isn't getting more data points. You're already drowning in spreadsheets and clipboard logs. The real issue is structuring your sampling cadence around risk inflection points rather than arbitrary time intervals.
Early fermentation (Days 1-3) needs twice-daily monitoring focused on lag phase duration and initial velocity establishment. Mid-fermentation (Days 4-10) can shift to daily sampling with trend analysis triggers. Late fermentation (Day 11+) requires return to twice-daily monitoring watching for deceleration patterns that predict stuck fermentations.
Temperature follows a different risk profile. A 2°F rise in four hours during peak fermentation is normal. That same rise during late fermentation signals potential VA production. Your sampling cadence needs to adjust based on fermentation stage.
Building trend-based red flags that actually prevent disasters
Static thresholds create false confidence. A tank at 14.5 Brix looks fine if your red flag threshold is 8 Brix for stuck fermentation. But if that tank dropped only 0.5 Brix in the last 36 hours when it should be dropping 2-3 Brix daily, you're in trouble territory.
Streamline your winery operations effortlessly.
Corkyly helps you track, manage, and optimize every step from vine to bottle.
- Vineyard & production tracking
- Customer relationship management
- Inventory & sales analytics
No credit card required
Velocity thresholds catch problems while you still have intervention options. Brix velocity red flags include drop rates below 1.0 Brix per day when above 10 Brix, drop rates below 0.5 Brix per day between 5-10 Brix, any acceleration after initial deceleration phase, and variance greater than 30% between consecutive velocity measurements.
Temperature velocity warnings cover rises greater than 3°F in 6 hours during late fermentation, drops greater than 5°F in 12 hours during active fermentation, and temperature-Brix velocity mismatches where high temperatures coincide with low Brix movement.
pH shift triggers include movement greater than 0.15 units in 24 hours, directional reversals within 48-hour windows, and pH-TA relationship deviations beyond 15% of varietal baseline.
These represent the inflection points where intervention still works. Miss these windows, and you're into damage control rather than prevention.
Treating all fermentations identically is a mistake. A Pinot Noir at 13.5% potential alcohol follows different kinetics than a Cabernet at 15.2%. Your red flag thresholds need adjustment matrices based on initial Brix, yeast strain characteristics, temperature program targets, and historical block fermentation patterns.
One operation lost 3,200 gallons of Merlot because their universal red flag system didn't account for the naturally slower fermentation rate of their high-Brix mountain fruit lots. The fermentation wasn't stuck — it was following the normal pattern for 27 Brix must. But their intervention ladder kicked in anyway, leading to unnecessary nutrient additions that pushed the fermentation too hot and created VA issues.
The corrective ladder that eliminates panic decisions
When a red flag triggers, most cellars default to either ignoring it ("wait and see") or overreacting (throwing every possible intervention at once). Neither approach works.
A structured corrective ladder removes emotion:
Level 1: Verification Protocol (0-4 hours after flag)
-
Resample from three tank depths
-
Run duplicate analysis on each sample
-
Check calibration logs for measurement equipment
-
Review previous 72 hours of data for transcription errors
-
Document findings in deviation log
Level 2: Passive Intervention (4-8 hours if verified)
-
Adjust temperature ±2°F from current
-
Perform gentle pump-over or punch-down
-
Take expanded panel (pH, TA, YAN, malic)
-
Calculate fermentation completion probability
-
Set 6-hour recheck schedule
Level 3: Active Intervention (8-12 hours if no improvement)
-
Microscopic examination for yeast viability
-
YAN addition if below 50mg/L
-
Temperature adjustment ±4°F from original
-
Increase cap management frequency by 50%
-
Prepare backup yeast for potential restart
Level 4: Aggressive Intervention (12-24 hours)
-
Complex nutrient addition protocol
-
Yeast hulls at 30g/hL
-
Consider yeast restart preparation
-
Pull sample for VA/4EP analysis
-
Document in lot deviation tracking system
A visual workflow of the corrective ladder helps remove ambiguity during a flag.
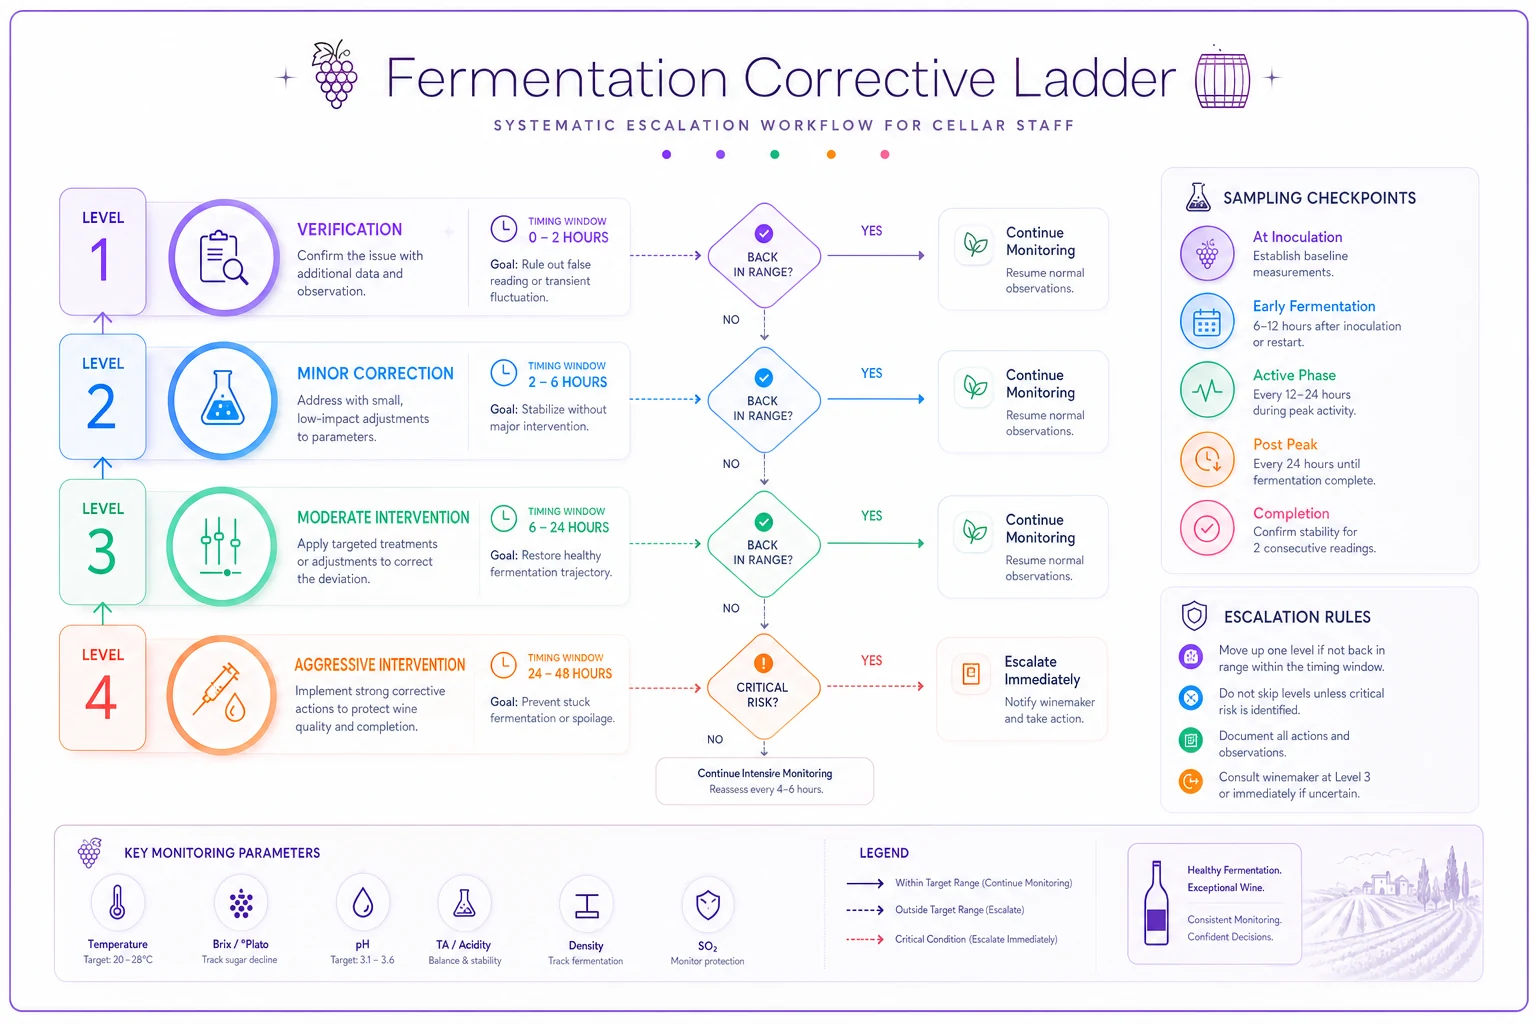
This ladder isn't about the specific interventions — it's the removal of decision-making during crisis moments. Your team knows exactly what to do and when.
Quick log templates that actually get used
Complex logging systems fail because nobody uses them consistently. The best approach uses pre-structured templates that take under 30 seconds to complete.
| Field | Entry |
|---|---|
| Tank | [___] |
| Date | [___] |
| Time | [___] |
| Operator | [___] |
| Brix | [___] |
| Temperature | [___] |
| 24hr Δ Brix | [___] |
| 24hr Δ Temperature | [___] |
| Flag Status | Green/Yellow/Red |
| Ladder Level | [___] |
| Action Taken | [___] |
| Next Check | [___] hours |
This captures everything needed for trend analysis without overwhelming operators. Current values plus rate of change, clear flag status using traffic light system, direct link to intervention ladder, and forced scheduling of next check.
For digital systems, these fields translate directly into database entries that trigger automatic calculations and alerts. The velocity calculations happen automatically, comparing current entries to previous timestamps.
Advanced operations layer in secondary templates for specific situations. Stuck fermentation assessments track hours since flag, current ladder level, sensory notes, microscopy counts, pH/TA/YAN values, and restart decisions.
The template forces documentation of decision rationale, critical for traceability when recalls or quality issues arise later.
Making this work with your actual crew
The best monitoring system means nothing if your crew doesn't execute it consistently.
Start with your most experienced cellar workers and run the new system parallel to your existing process for one week. They'll quickly identify which velocity thresholds make sense and which create false alarms. A Burgundian-trained assistant winemaker will have different trigger sensitivities than someone from Napa — use that experience to calibrate your thresholds.
Train sampling consistency obsessively. The biggest source of false velocity signals comes from inconsistent sampling techniques. One person pulls from the sample valve, another uses a thief from the top. One person runs Brix immediately, another lets samples warm to room temperature first. These variations create noise that obscures real trends.
Build your escalation paths before you need them. When a red flag triggers at 2 AM during harvest, your night crew needs clear authority to execute Level 1 and 2 interventions without calling the winemaker. But they also need hard stops that require authorization for Level 3+ actions.
The documentation burden has to match your operation's reality. A 5,000-case winery can't maintain the same logging detail as a 50,000-case operation. Focus detailed monitoring on high-risk fermentations (high Brix, difficult varietals, premium programs) while using simplified protocols for standard lots.
Connecting fermentation data to downstream decisions
Your fermentation monitoring data becomes invaluable for blending decisions months later. Lots that showed velocity irregularities often develop distinct sensory profiles that need special handling in blend trials.
Track which intervention ladder levels were triggered for each lot. A wine that required Level 3 intervention might blend beautifully at 5-10% to add complexity, but become problematic at higher percentages. This historical data prevents repeating expensive blending mistakes.
The most sophisticated operations encode fermentation behaviors into lot grades immediately post-fermentation. A lot with perfect fermentation kinetics gets Grade A status. Minor velocity issues but successful completion earns Grade B. Anything requiring Level 4 intervention automatically drops to Grade C. These grades then drive everything from barrel selection to pricing decisions.
The software piece of the puzzle
Manual velocity calculations and trend analysis eat hours during harvest when you have none to spare. AI-powered operational software can process your fermentation measurements in real-time, automatically flag velocity anomalies, and predict stuck fermentations 48-72 hours before they occur.
The real value isn't replacing human judgment — it's freeing your cellar team from manual calculations so they can focus on actual winemaking decisions. When software handles the trend analysis and alert generation, your team spends time fixing problems instead of finding them. Modern platforms can coordinate your intervention ladder, automatically scheduling follow-up samples and tracking which corrective actions have been completed.
Moving beyond crisis management
The wineries that excel at fermentation management aren't the ones with the most sophisticated labs or the most frequent sampling. They built systems matching their operational reality and execute them religiously.
Your fermentation monitoring system should prevent problems, not just document them. Every stuck fermentation you prevent saves roughly $3,000-8,000 in direct costs (labor, materials, tank time) plus whatever quality impact you avoid. For a 10,000 case winery preventing two stuck fermentations per vintage, that's a $15,000 annual impact from better monitoring alone.
The transition from reactive to predictive fermentation management doesn't require massive investment. It requires structuring the data you're already collecting around velocity patterns, building clear escalation ladders, and giving your crew the tools and authority to intervene before problems become crises.
Start with one thing: add velocity calculations to your existing fermentation logs. Track Brix drop rate and temperature change rate for every measurement. Within one harvest season, you'll see patterns that static measurements completely miss. Those patterns become your early warning system for the vintages ahead.
Ready to elevate your winery management?
Join 500+ wineries using Corkyly to increase operational efficiency, boost customer loyalty, and grow sales.