
Walk through any mid-sized winery's production facility and you'll find dashboards everywhere. Fermentation temperatures on iPads mounted to tank walls. Bottling speeds displayed on monitors above the line. Inventory counts projected on break room screens. Everyone's tracking something.
But when you dig into their actual margins, the story gets messy. Labor costs creep up quarter after quarter. Yield efficiency drops during peak harvest. Product gets stuck in tanks longer than planned, eating into cash flow. The disconnect between what they measure and what moves their business becomes obvious when you map their actual operational flow against their KPI selection.
The core problem isn't lack of data—it's measuring the wrong things at the wrong organizational levels. Your cellar master needs different metrics than your CFO. Your vineyard manager's KPIs shouldn't mirror your tasting room supervisor's.
Most wineries apply generic industry benchmarks across all roles, then wonder why their beautifully designed dashboards don't translate into better margins.
Why traditional winery KPIs create blind spots instead of insights
The wine industry inherited its measurement framework from manufacturing, then layered on hospitality metrics, then added agricultural standards. The result? A Frankenstein collection of KPIs that sound important but miss the operational realities of running a modern winery.
Take the classic "cases produced per year" metric. Sounds fundamental, right? Except it tells you nothing about profitability per case, labor efficiency during production runs, or whether you're optimizing tank utilization.
A winery producing 50,000 cases might be less profitable than one producing 15,000 if their operational costs are misaligned with their price points.
Or consider "wine club retention rate"—a favorite among marketing teams. Sure, 85% retention sounds healthy. But if your fulfillment costs have increased 30% due to shipping inefficiencies and your club members are buying less per shipment, that retention metric becomes meaningless. You're celebrating loyalty while hemorrhaging margin.
The agricultural side creates its own measurement chaos. Wineries obsess over tons per acre without considering the labor hours required to achieve those yields. During one harvest season, I watched a vineyard team celebrate hitting 4.2 tons per acre on their Cabernet blocks—meanwhile, their labor costs had spiked to $1,400 per ton because they'd pushed for quantity over operational efficiency. Their gross margin actually decreased despite the higher yield.
These misalignments compound as operations scale. Small wineries can absorb inefficiencies through owner sweat equity and informal coordination. Once you're processing multiple varietals across different vineyard blocks, managing seasonal labor crews, and juggling direct-to-consumer with distribution channels, those measurement gaps become profit sinkholes.
The hidden cost of measuring production without measuring flow
Most winery KPI frameworks treat production as a series of isolated checkpoints rather than an interconnected flow. You measure fermentation completion rates, bottling speeds, and case goods inventory—but miss the operational friction between each stage.
Streamline your winery operations effortlessly.
Corkyly helps you track, manage, and optimize every step from vine to bottle.
- Vineyard & production tracking
- Customer relationship management
- Inventory & sales analytics
No credit card required
Picture a typical harvest scenario: Your vineyard team crushes 12 tons of Pinot on Tuesday morning. Fermentation tracking shows everything progressing normally. Tank utilization reports look good.
But nobody's measuring the four-day delay before that lot moves to barrels because your cellar crew is backed up from the previous week's Chardonnay.
That delay cascades—tanks aren't available for the next pick, overtime labor kicks in to catch up, and suddenly your cost-per-gallon has jumped 18% on what looked like a textbook fermentation.
The flow problem intensifies in the bottling hall. Wineries track bottles-per-hour religiously but ignore setup time between runs, partial pallet efficiency, or the labor cost of moving cases from temporary to long-term storage. A bottling line running at 2,000 bottles per hour means nothing if you're losing 90 minutes to changeovers between SKUs and requiring double the warehouse touches to manage the output.
Even worse: the disconnect between production flow and sales velocity. Your cellar might efficiently produce 500 cases of that limited-edition Syrah, but if it sits in finished goods inventory for 14 months because nobody coordinated with the sales team on release timing, you've just locked up working capital that could've funded your entire harvest labor budget.
Role-specific KPIs that actually drive decisions (with exact formulas)
Vineyard Manager KPIs
Labor Cost per Ton Harvested Formula: (Total harvest labor hours × average hourly rate) ÷ tons harvested Data source: Payroll system + harvest receiving logs Action trigger: When exceeding $280/ton for premium fruit or $180/ton for bulk wines
Yield Efficiency Score Formula: (Actual tons harvested ÷ projected tons) × (target brix achieved ÷ total blocks) Data source: Harvest projections + lab reports Action trigger: Score below 0.85 for two consecutive picks
Block Profitability Index Formula: (Revenue per ton from block - total farming cost per ton) ÷ district average margin Data source: Sales data by lot + cost accounting by block Action trigger: Index below 0.9 for two consecutive vintages
Cellar Master/Winemaker KPIs
Tank Turnover Velocity Formula: Gallons processed ÷ (tank capacity × days in period) Data source: Cellar management system Action trigger: Below 4.5 turns annually for fermentation tanks
Labor Hours per 1000 Gallons Processed Formula: Total cellar labor hours ÷ (gallons processed ÷ 1000) Data source: Timekeeping system + production logs Action trigger: Exceeding 22 hours per 1000 gallons for still wines
Lot Cycle Time Formula: Days from crush to case goods Data source: Production tracking system Action trigger: Exceeding planned cycle time by 20%
Production Manager KPIs
True Bottling Cost per Case Formula: (Direct bottling labor + materials + allocated overhead + rework costs) ÷ cases produced Data source: Cost accounting + production records Action trigger: Exceeding $8.50/case for standard packaging
Schedule Adherence Rate Formula: Bottling runs completed on scheduled date ÷ total scheduled runs Data source: Production planning system Action trigger: Below 75% for any month
Finished Goods Velocity Formula: Cases shipped ÷ average finished goods inventory Data source: Inventory system + shipping records Action trigger: Below 8 turns annually
| Role | KPI | Formula |
|---|---|---|
| Vineyard Manager | Labor Cost per Ton Harvested | (Total harvest labor hours × average hourly rate) ÷ tons harvested |
| Vineyard Manager | Yield Efficiency Score | (Actual tons harvested ÷ projected tons) × (target brix achieved ÷ total blocks) |
| Vineyard Manager | Block Profitability Index | (Revenue per ton from block - total farming cost per ton) ÷ district average margin |
| Cellar Master/Winemaker | Tank Turnover Velocity | Gallons processed ÷ (tank capacity × days in period) |
| Cellar Master/Winemaker | Labor Hours per 1000 Gallons Processed | Total cellar labor hours ÷ (gallons processed ÷ 1000) |
| Cellar Master/Winemaker | Lot Cycle Time | Days from crush to case goods |
| Production Manager | True Bottling Cost per Case | (Direct bottling labor + materials + allocated overhead + rework costs) ÷ cases produced |
| Production Manager | Schedule Adherence Rate | Bottling runs completed on scheduled date ÷ total scheduled runs |
| Production Manager | Finished Goods Velocity | Cases shipped ÷ average finished goods inventory |
Tasting Room Manager KPIs
Revenue per Guest Hour Formula: Total tasting room revenue ÷ sum of all guest visit durations Data source: POS system + reservation/timing data Action trigger: Below $45/hour on weekends, below $30/hour on weekdays
Conversion Value Ratio Formula: (Average purchase of buyers ÷ average tasting fee) × purchase rate Data source: POS transaction data Action trigger: Below 3.5
Club Acquisition Cost Formula: (Tasting room labor during sign-ups + marketing costs + incentives) ÷ new members Data source: Multiple—payroll, marketing spend, POS Action trigger: Exceeding 40% of first shipment value
CFO/Owner KPIs
Cash Conversion Cycle Formula: Days Inventory Outstanding + Days Sales Outstanding - Days Payables Outstanding Data source: Financial statements Action trigger: Exceeding 180 days
Gross Margin per Production Dollar Formula: (Revenue - COGS) ÷ total production expense Data source: P&L statement Action trigger: Below $1.40
Channel Profitability Index Formula: (Channel gross margin - channel-specific costs) ÷ channel revenue Data source: Channel-specific P&L analysis Action trigger: Any channel below 15%
DTC might show 65% gross margin, but after tasting room labor, shipping, and compliance, actual profitability could be lower than wholesale. This metric reveals truth.
Building dashboards that drive action, not just display data
Raw KPIs without context are just numbers on a screen. Effective operational dashboards follow specific design principles that transform data into decisions.
Start with the trigger visualization principle. Instead of showing trend lines, display each KPI relative to its action threshold. Use simple red/yellow/green coding, but base the colors on your specific triggers, not arbitrary "good/bad" ranges.
When the vineyard manager opens their dashboard, they should immediately see that Block 7's labor cost hit $312/ton—well into the red zone—without hunting through reports.
Layer in context through comparative frames. Don't just show this month's tank turnover velocity—show it against the same period last year, against your annual target, and against the previous three months. This comparative context prevents overreaction to normal seasonal variation while highlighting genuine problems.
The most overlooked aspect: decision prompts built into the interface. When a KPI exceeds its trigger, the dashboard shouldn't just flash red. It should surface the specific decision required.
Labor cost per ton over threshold? The prompt reads: "Evaluate: 1) Move to machine harvesting for remaining blocks, 2) Adjust pick schedule to avoid overtime, 3) Renegotiate current piece rate." This transforms passive monitoring into active management.
For multi-site operations or larger wineries, role-based filtering becomes critical. Your cellar master doesn't need to see tasting room conversion rates during morning tank checks. Build separate dashboard views for each role, updated at appropriate frequencies.
Configure dashboard refresh frequencies by role and season to reduce noise and keep attention on harvest-critical KPIs.
Vineyard KPIs might refresh weekly during growing season but daily during harvest. Tasting room metrics update hourly on weekends but daily during the week.
The technical architecture matters less than the behavioral design. Whether you're using Tableau, Power BI, or even well-structured spreadsheets, the key is automatic data flow from source systems. Manual data entry kills dashboard adoption. If someone has to update numbers manually, they won't, and your carefully designed triggers become useless.
Decision rules that prevent analysis paralysis
Having KPIs and dashboards means nothing without clear decision frameworks. Wineries that successfully improve margins using these metrics follow explicit decision rules that remove ambiguity from the response.
For single-trigger decisions, the rule is straightforward. When labor hours per 1000 gallons exceeds 22 hours, you immediately audit the last five cellar operations to identify the variance source. No committee meetings, no waiting for month-end. The trigger drives immediate investigation.
Multi-trigger decisions require more nuance. When both tank turnover velocity and lot cycle time hit red zones simultaneously, you're dealing with systemic flow problems, not isolated inefficiencies.
The decision rule: convene a rapid improvement team within 48 hours, map the current state process, and identify the top three bottlenecks within one week. The specificity prevents the common winery tendency to discuss problems endlessly without acting.
Seasonal triggers need different rules. During harvest, when yield efficiency scores drop below 0.85, you can't wait for committee consensus. The rule: vineyard manager has authority to adjust picking decisions immediately but must document the reasoning for post-harvest review.
-
First trigger breach
operational manager investigates and reports findings
-
Second consecutive breach
requires cross-functional review
-
Third breach
executive intervention required
This graduated response ensures minor variations don't cause organizational thrash while preventing serious issues from being ignored.
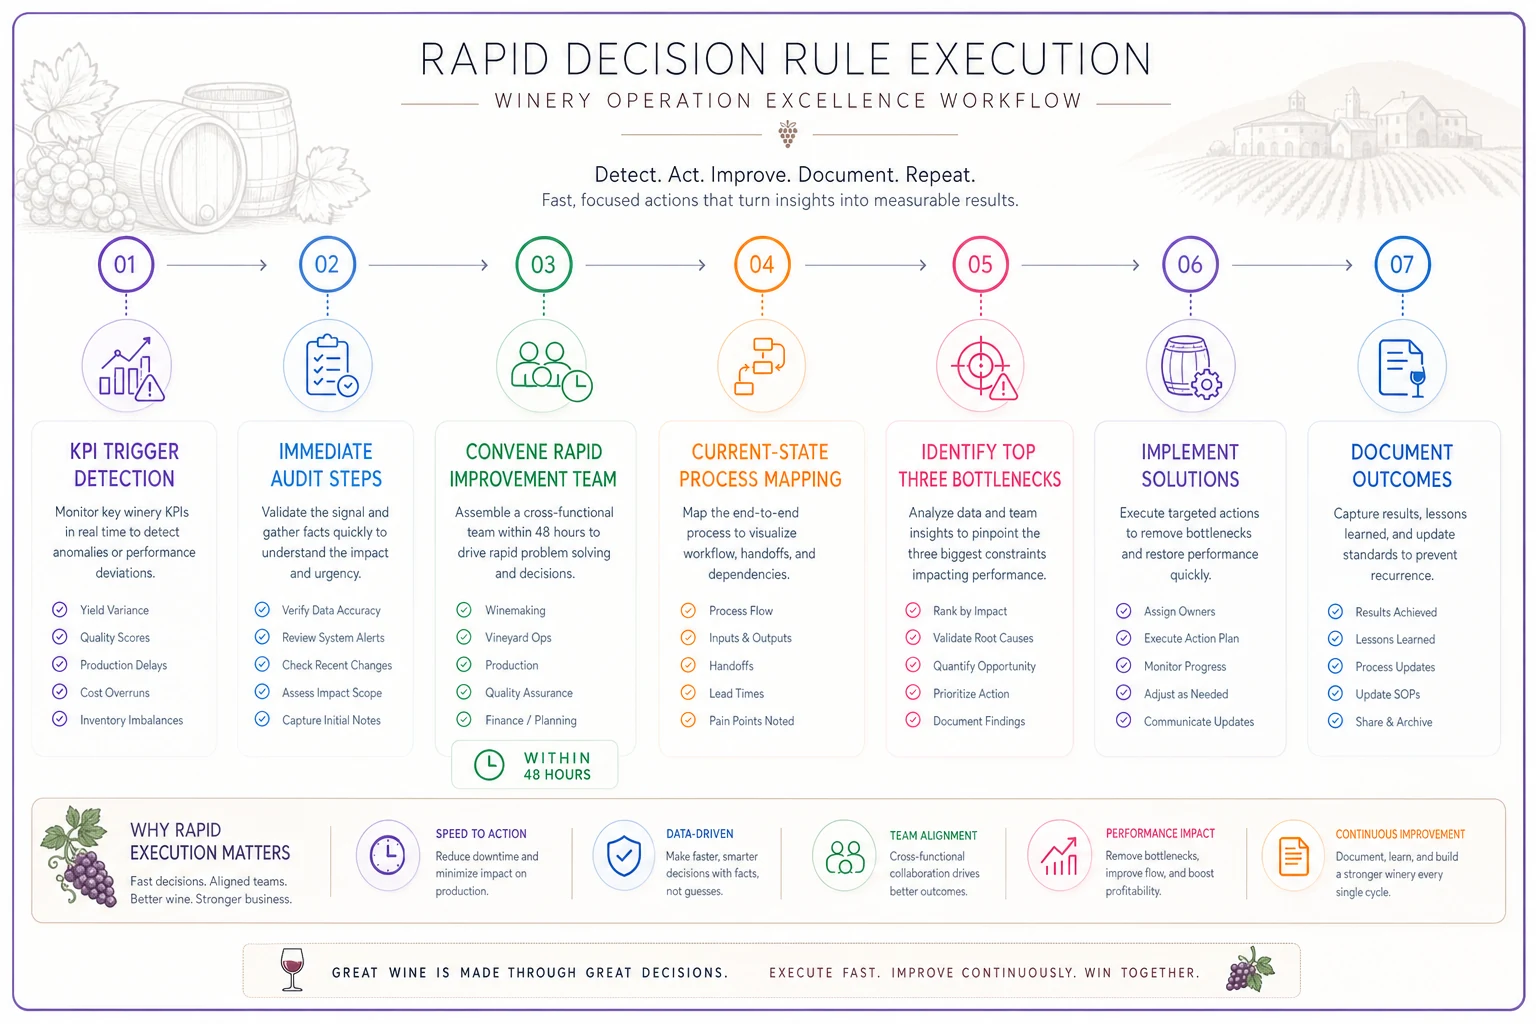
Use this workflow visualization when you convene teams so everyone understands the timeline and expected outputs.
For capital-intensive decisions, threshold breaches trigger investigation, not immediate action. When block profitability index stays below 0.9 for two vintages, the rule initiates a formal analysis: complete cost breakdown, alternative scenario modeling, and presentation to ownership within 30 days. The timeline prevents rushed decisions while ensuring problems don't linger indefinitely.
Common implementation failures (and how to avoid them)
Even with perfect KPIs and beautiful dashboards, implementation usually fails for predictable reasons.
Trying to implement everything simultaneously is the biggest killer. One 8,000-case winery attempted to roll out 47 KPIs across all departments in a single quarter. Six months later, nobody was using any of them. The cognitive overload killed adoption before habits could form.
Start with three KPIs per role, maximum. Run them for a full production cycle—crush through bottling—before adding more. This allows teams to develop muscle memory around checking metrics and acting on triggers.
Once those first KPIs become automatic, layer in additional metrics gradually.
Disconnected data systems that require manual compilation kill momentum fast. Your vineyard data lives in spreadsheets, production data in cellar management software, financial data in QuickBooks, and sales data in the POS system. Someone spends hours every week copying numbers between systems, introducing errors and delays that make KPIs useless for real-time decisions.
The fix isn't necessarily expensive integration. Start by identifying which KPIs need real-time data versus weekly updates. Tank turnover velocity might need daily calculation during harvest but monthly during winter.
Design your data flow around these requirements. Sometimes a simple automated export from each system into a central spreadsheet beats complex integration projects that never finish.
Role confusion destroys accountability. When everyone monitors everything, nobody owns anything. Your tasting room manager shouldn't be held accountable for production KPIs they can't influence. Your cellar master shouldn't stress about wine club retention.
Clear ownership means each person knows exactly which metrics they're responsible for and has the authority to act when triggers are breached. This prevents the blame game when KPIs slip—the owner is clear, and so is the responsibility to respond.
The "perfect data" trap paralyzes many wineries. They delay implementation waiting for pristine historical data, completely automated systems, or ideal tracking mechanisms. Meanwhile, operational inefficiencies compound daily.
Start with 80% accuracy and improve over time. Directionally correct decisions based on good-enough data beat perfect analysis that arrives too late.
Turning KPI insights into sustainable margin improvements
The real test of any KPI system isn't whether numbers improve temporarily—it's whether improvements stick and compound over time. This requires embedding KPI-driven decisions into operational rhythms, not treating them as separate activities.
Weekly production meetings should start with KPI review, not end with it. Open with five minutes reviewing triggered metrics, assign investigation owners immediately, then move to regular agenda items. This makes KPI response automatic, not something that happens "if we have time."
Create learning loops from trigger responses. When high labor costs per ton trigger a change in harvest scheduling, document both the trigger and the response. Six months later, review: Did the change reduce costs? By how much? What secondary effects occurred?
This builds institutional knowledge that makes future responses more effective.
The compounding effect comes from connecting KPI improvements across departments. When better tank turnover velocity frees up capacity, production can schedule smaller, more frequent bottling runs. This reduces finished goods inventory, improving cash conversion cycles, which provides capital for vineyard improvements that reduce labor costs per ton
The compounding effect comes from connecting KPI improvements across departments. When better tank turnover velocity frees up capacity, production can schedule smaller, more frequent bottling runs. This reduces finished goods inventory, improving cash conversion cycles, which provides capital for vineyard improvements that reduce labor costs per ton
Ready to elevate your winery management?
Join 500+ wineries using Corkyly to increase operational efficiency, boost customer loyalty, and grow sales.