
Most vineyard managers stare at NDVI maps like they're abstract art. Beautiful gradients of red and green spread across their blocks, thermal imagery shows hot spots and cool zones, vigor maps reveal stressed vines. The drone company delivers a neat PDF report every week. Then what?
The disconnect between remote sensing data and actual crew work is massive. You've got a $45,000 annual remote sensing contract generating gorgeous weekly imagery. Your crew chief shows up Monday morning asking where to send the eight-person canopy management team. The two worlds rarely connect.
Remote sensing vineyard operations only work when you convert map anomalies into specific, ranked tasks that crews can execute. Not "Block 7 shows stress." But "Send Maria's team to rows 14-18 of Block 7 for shoot positioning before 11am Tuesday."
The translation problem nobody talks about
Remote sensing companies sell data, not decisions. They deliver normalized difference vegetation index values ranging from -1 to 1. They provide thermal readings in degrees Celsius. They generate vigor classifications from "very low" to "very high."
Your crew needs to know whether to drop fruit in row 23 or add a second irrigation set to block 4.
The gap between these two realities costs operations roughly $18,000-26,000 per season in misallocated labor and delayed interventions. A typical 120-acre vineyard running remote sensing without proper task translation sends crews to the wrong blocks about 35% of the time during critical periods.
Last season, Carneros operations started tracking this. They found crews spending entire mornings working low-priority areas while NDVI-identified stress zones went untouched for days. The thermal imagery showed clear irrigation issues in blocks 8-11 on Tuesday. Crews didn't get there until the following Monday because nobody translated "thermal anomaly at coordinates 38.2419° N, 122.3706° W" into "Juan's team needs to check emitters on the south side of block 9 immediately."
Building conversion rules that crews actually follow
Forget complex algorithms. Operational remote sensing needs simple, repeatable rules that convert imagery patterns into task priorities.
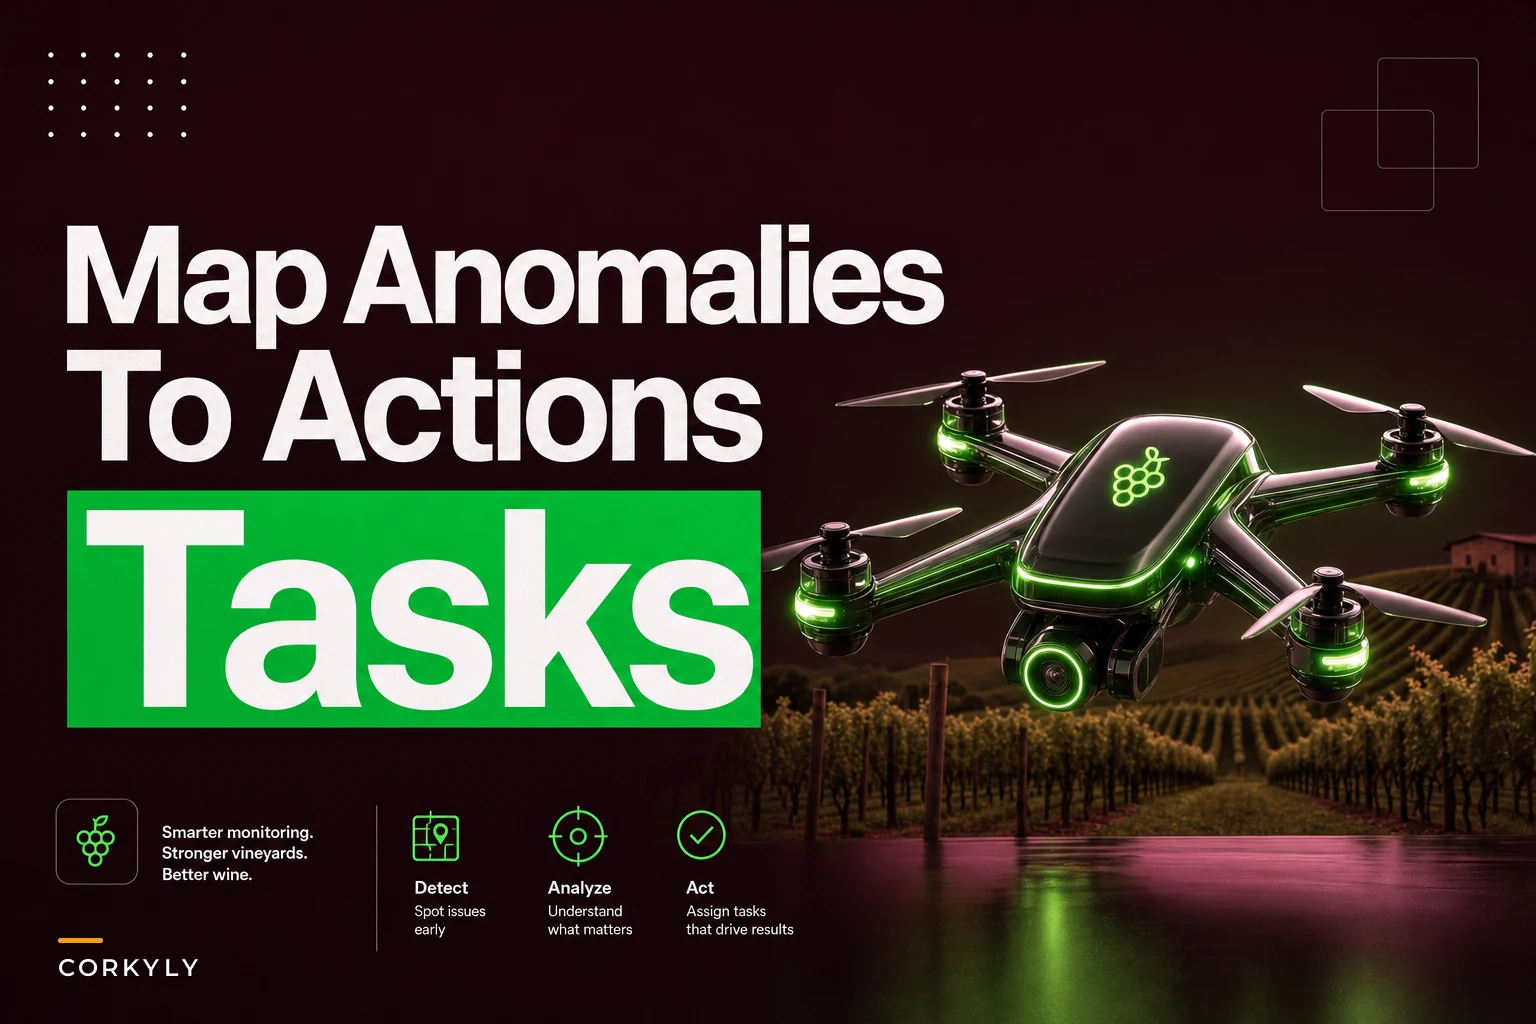
Streamline your winery operations effortlessly.
Corkyly helps you track, manage, and optimize every step from vine to bottle.
- Vineyard & production tracking
- Customer relationship management
- Inventory & sales analytics
No credit card required
NDVI below 0.3 in July:
-
Priority 1
Check soil moisture immediately
-
Priority 2
Inspect for pest damage within 24 hours
-
Priority 3
Schedule tissue sampling within 3 days
NDVI variance exceeding 0.15 within a block:
-
Morning task
Walk the boundary between high/low zones
-
Document
Irrigation coverage, vine health, canopy differences
-
Decision point
Selective harvest vs. remediation
Thermal readings above 95°F for 3+ consecutive days:
-
Immediate
Verify irrigation system operation
-
Same day
Adjust canopy exposure on southwest faces
-
Next morning
Check fruit sunburn in exposed clusters
The conversion becomes mechanical. No interpretation needed. Your vineyard foreman sees the thermal alert, checks the rule sheet, assigns the task.
Weekly cadence that matches crew scheduling
Remote sensing data arrives continuously. Crew schedules happen weekly. This mismatch breaks most operations.
A Monday morning translation rhythm that works:
Thursday 3pm: Remote sensing imagery arrives Thursday 4pm: Automated threshold analysis runs Friday 9am: Anomaly zones get ranked by severity and acre coverage Friday 2pm: Draft task list generated from conversion rules Monday 7am: Finalized priority list ready for crew assignment
The three-day gap seems inefficient until you realize most vineyard issues develop over weeks, not hours. That vigor problem in block 12 didn't appear overnight. The slight NDVI decline in the northwest corner has been building since early June.
This cadence gives you time to validate anomalies against ground truth. About 20% of remote sensing "problems" turn out to be imagery artifacts, shadow effects, or recent management activities like mowing that temporarily affect readings.
The ranked task list crews actually use
Your Monday morning task sheet needs to look like this:
Priority 1 - Complete before noon:
-
Block 4, rows 12-16
Thermal stress >98°F for 5 days, check/repair drippers
-
Block 9, rows 1-8
NDVI drop of 0.2 in one week, scout for leafhopper damage
-
Block 2, southwest corner
Vigor decline pattern suggests gopher activity, set traps
Priority 2 - Complete by end of day:
-
Block 7, entire
Moderate NDVI variance (0.12), mark zones for differential harvest
-
Block 11, rows 20-30
Gradual thermal increase, verify soil moisture at 18" depth
-
Block 3, north end
Low vigor consistency, schedule tissue sample collection
Priority 3 - Complete this week:
-
Blocks 5-6
Uniform high NDVI, plan shoot thinning for Thursday
-
Block 10
Slight thermal elevation, monitor and reassess Friday
-
Block 1
Historical low vigor area showing improvement, document changes
No coordinates. No decimal degrees. No technical jargon. Your crew chief sees exactly where to go and what to do.
Real anomaly patterns and their task triggers
The irrigation skip pattern: Parallel lines of low NDVI spaced at your irrigation row interval. Usually shows up first in thermal imagery as repeating hot strips. Task trigger: immediate emitter inspection on affected rows, typically finds clogged drippers or pressure issues on specific laterals.
The edge effect gradient: NDVI gradually declining from field center toward borders, often 15-20% lower within 30 feet of edges. Common in blocks adjacent to roads or uncultivated areas. Task trigger: targeted foliar nutrition program for perimeter vines, adjusted irrigation timing for edge rows, more aggressive weed control in buffer zones.
The pocket decline: Circular or irregular patches of declining vigor, usually 0.25-0.5 acres in size. NDVI drops 0.1-0.15 over 2-3 weeks while surrounding vines remain stable. Task trigger: immediate soil sampling at multiple depths, root inspection for phylloxera or nematodes, check drainage patterns after next irrigation.
The vigor flip: Areas historically showing low vigor suddenly spike in NDVI, often after rain events or fertigation. Indicates uneven water infiltration or nutrient availability. Task trigger: soil structure assessment, consider targeted gypsum application, adjust irrigation duration rather than frequency.
Checklists that prevent operational breakdown
A Napa operation with 200 acres under remote sensing switched to checklist-driven task assignment. Their missed-anomaly rate dropped from around 40% to under 12%.
Monday Morning Remote Sensing Review Checklist:
-
[ ] All imagery from past week loaded and processed
-
[ ] Automated thresholds applied to NDVI, thermal, and vigor layers
-
[ ] Anomalies ranked by
acres affected, severity score, days persisting
-
[ ] Cross-check with last week's task completion report
-
[ ] Weather forecast reviewed for context (recent rain, heat spike, etc.)
-
[ ] Ground-truthing notes from crew added to anomaly zones
-
[ ] Task list generated with specific row numbers and deadlines
-
[ ] Resources needed identified (tissue sample bags, moisture meter, etc.)
-
[ ] Crew chief briefed with printed maps and task sheets
-
[ ] Follow-up verification scheduled for completed priority-1 tasks
Anomaly-to-Task Conversion Checklist:
-
[ ] Anomaly type identified (thermal, NDVI, vigor, or combination)
-
[ ] Persistence checked (new, continuing, or worsening)
-
[ ] Size calculated (acres and approximate row count)
-
[ ] Historical data reviewed (is this zone always problematic?)
-
[ ] Potential causes listed based on pattern and season
-
[ ] Required tools/supplies identified
-
[ ] Estimated crew hours calculated
-
[ ] Verification method defined (moisture check, tissue sample, visual inspection)
-
[ ] Success metric established (NDVI improvement, temperature reduction, etc.)
-
[ ] Escalation trigger set (if not resolved in X days, then...)
A Sonoma operation runs monthly calibration sessions where field crews review anomaly maps against their ground observations. They've refined their conversion rules to achieve about 85% accuracy - meaning 85% of flagged anomalies represent real issues requiring intervention.
When thermal beats NDVI (and when it doesn't)
Thermal imagery reacts faster than NDVI to stress events. Temperature spikes show up 5-7 days before vegetation indices register problems. But thermal also generates more false positives.
A block that just got leaf-pulled will show elevated temperatures for days. Doesn't mean the vines are stressed. Morning thermal flights catch dew patterns that look like irrigation issues but disappear by noon. Wind exposure creates thermal variations that have nothing to do with vine health.
NDVI provides a more stable stress indicator but lags behind actual conditions. By the time NDVI drops significantly, you've already lost potential yield or quality. The vegetation index works best for tracking gradual changes and comparing relative vigor across blocks.
The operational sweet spot: Use thermal for early warning, NDVI for confirmation, vigor maps for harvest planning.
Thermal anomaly appears → Check within 48 hours → If persistent for 3+ days → Verify with NDVI → If both indicate stress → Immediate intervention
Integrating weather data with anomaly interpretation
Remote sensing without weather context generates busy work. That NDVI decline in block 7 might indicate severe stress. Or it might reflect normal hardening off after last week's 105°F heat spike.
Growing degree days (GDD): Rapid GDD accumulation often triggers temporary NDVI plateaus. Not a problem, just phenology.
Evapotranspiration (ET): When ET exceeds irrigation application by 30%+ for multiple days, thermal anomalies become priority-1 tasks.
Wind run: High wind exposure creates thermal patterns that mimic water stress. Check wind data before sending crews to investigate "hot spots" on exposed slopes.
Humidity drops: Relative humidity below 25% for extended periods causes stomatal closure that shows up in both thermal and NDVI. Often requires no intervention beyond monitoring.
A Central Coast operation started overlaying weather data with remote sensing alerts. They eliminated about 25% of unnecessary field checks by recognizing weather-induced patterns that self-correct.
The software bridge between maps and Monday mornings
Manual translation of remote sensing data breaks down around 50 acres. Beyond that scale, you need systematic conversion of imagery into tasks.
Operational platforms handle the heavy lifting. Modern remote sensing vineyard operations run on software that ingests imagery layers, applies your conversion rules, and generates ranked task lists automatically. The platform tracks anomaly history, monitors task completion, and adjusts priorities based on weather forecasts and crew availability.
This diagram shows the workflow from imagery ingestion to an actionable Monday morning task list.
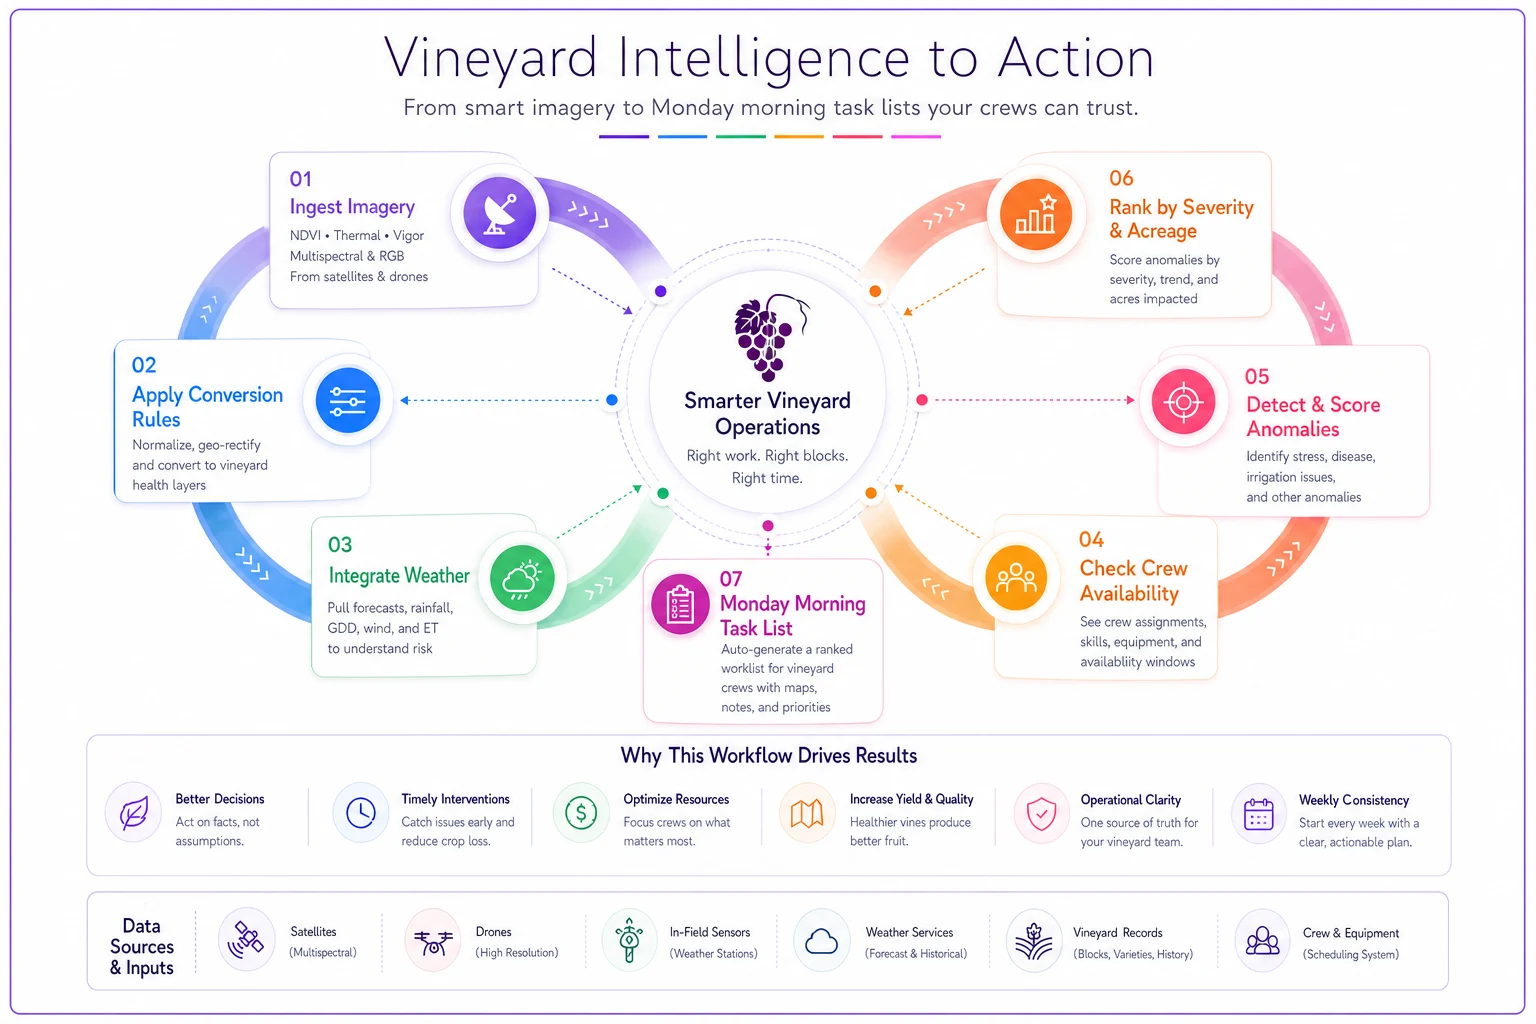
The automation handles pattern matching across multiple imagery sources. When thermal and NDVI both flag the same zone, priority automatically increases. When an anomaly persists across multiple imaging cycles, it triggers escalation. When weather data suggests natural stress recovery, tasks get delayed rather than assigned immediately.
These AI-enhanced platforms learn your operation's patterns. Block 7 always shows thermal stress on south-facing slopes during July heat waves - the system learns to deprioritize these expected patterns while flagging unusual anomalies that actually need attention.
Your Monday morning task list appears automatically, ranked by actual field priority rather than whoever looked at the maps last. Crews know exactly where to go, what to check, and which tools to bring.
Verification loops that improve conversion accuracy
Your conversion rules need continuous refinement. That NDVI threshold that worked in June might generate false positives in August.
Same-day verification: Crew chief reports back on priority-1 tasks by end of shift. Was the anomaly real? Did the suspected cause match field conditions?
Weekly calibration: Compare last week's alerts to actual field findings. Adjust thresholds if false positive rate exceeds 20% or missed problems exceed 10%.
Seasonal documentation: Track which conversion rules consistently identify real problems versus those generating unnecessary tasks. Some operations find their thermal thresholds need adjustment every 3-4 weeks during summer.
Crew feedback integration: Field teams often spot patterns the office misses. That "irrigation problem" might actually be gopher damage. The "nutrient deficiency" could be herbicide drift from the neighboring property.
A Sonoma operation runs monthly calibration sessions where field crews review anomaly maps against their ground observations. They've refined their conversion rules to achieve about 85% accuracy - meaning 85% of flagged anomalies represent real issues requiring intervention.
Cost reality of proper translation infrastructure
Running remote sensing without proper task translation wastes money in two directions: paying for imagery you don't use effectively, and sending crews to investigate false positives.
Typical cost breakdown for 150-acre vineyard operation:
| Category | Without translation system | With systematic translation |
|---|---|---|
| Remote sensing contract | Remote sensing contract: $32,000/year | Remote sensing contract: $32,000/year (same) |
| Misallocated crew time | Misallocated crew time: ~320 hours at $25/hour = $8,000 | Reduced misallocation: ~80 hours at $25/hour = $2,000 |
| Delayed intervention losses | Delayed intervention losses: $12,000-18,000 (varies by year) | Prevented losses through timely intervention: $3,000-5,000 |
| Manual map review time | Manual map review time: 6 hours weekly x 20 weeks = 120 hours | Automated processing: 1 hour weekly review x 20 weeks = 20 hours |
| Translation software/platform | Translation software/platform: not used | Translation software/platform: $4,800-6,000/year |
| Total operational cost | Total operational cost: $52,000-58,000 | Total operational cost: $41,800-45,000 |
The translation system pays for itself through labor efficiency alone, before considering yield protection benefits.
Making peace with imperfect translation
No conversion system achieves perfect accuracy. Vineyard biology remains too complex, too variable, too influenced by factors imagery cannot capture.
Accept these realities:
Some anomalies will be shadows, not stress. Some crew visits will find nothing wrong. Some real problems will hide between imaging flights. Some conversion rules will need mid-season adjustment.
The goal isn't perfection - it's operational improvement. Moving from random field scouting to targeted investigation. From reactive problem discovery to proactive intervention. From arguing about where to send crews to following clear, data-driven priorities.
Even 70% accuracy in anomaly-to-task conversion beats the alternative: either ignoring remote sensing data entirely or treating every colorful blob on a map as urgent.
Remote sensing vineyard operations succeed when you focus on translation consistency rather than perfection. Same rules every week. Same ranking process every Monday. Same verification loop every Friday. The system improves through repetition, crews learn the patterns, and those expensive imagery layers finally convert into better operational decisions.
Build your conversion rules. Test them against reality. Refine based on results. Stop treating remote sensing as abstract data and start treating it as Monday morning's task list. That's when those beautiful maps actually start improving your vineyard operations.
Ready to elevate your winery management?
Join 500+ wineries using Corkyly to increase operational efficiency, boost customer loyalty, and grow sales.